

.png)
It’s one of the most well-documented problems in clinical research, yet year after year, it persists: the vast majority of clinical trials fail to enroll on time. But the reason this keeps happening is not because “enrollment is simply too slow.”
Think of it this way. The average recreational marathoner finishes in about four and a half hours. If a running coach promised every athlete a three-hour finish, then reported each one as "an hour and a half behind pace," we wouldn't blame the runners—we'd question the forecast.
This leaves us with daunting stats around missed targets and doubled enrollment timelines. So why does this keep happening? And what are the sponsors who do enroll on time doing differently?
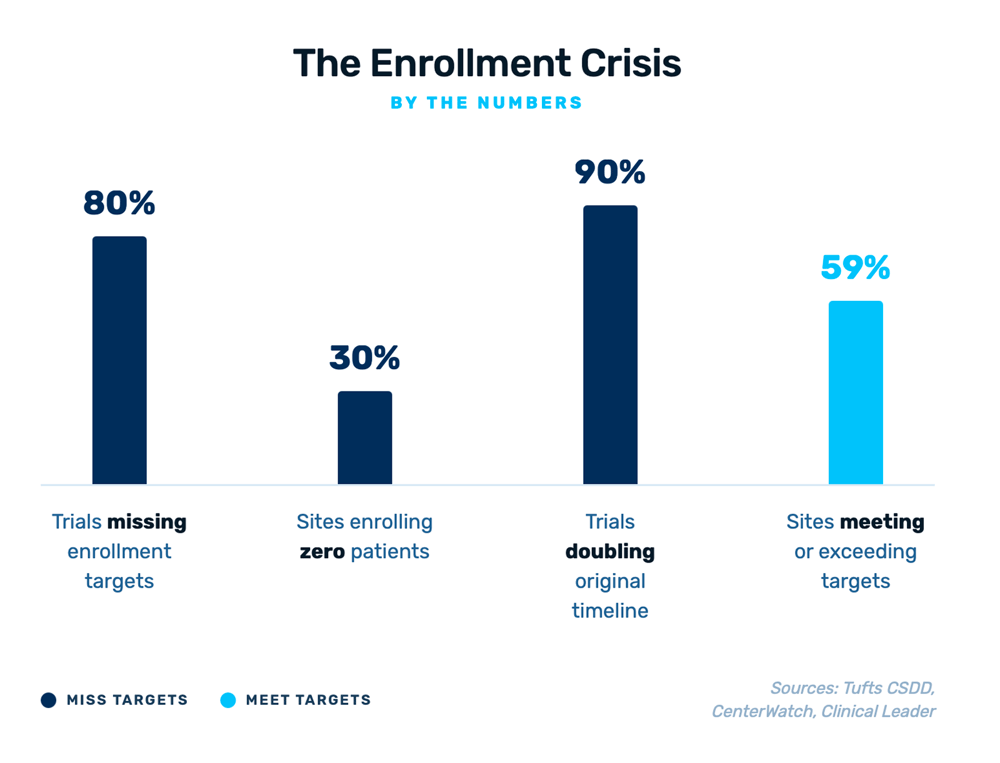
The enrollment crisis persists across virtually every metric.
Read on to learn:
The Forecasting Problem No One Wants to Talk About
Most enrollment forecasting still relies on the same approach it did a decade ago: a combination of historical averages, unrealistic assumptions, and spreadsheets utilizing algebra.
- 300 patients enrolled in 13 months you say?
- Easy! Take a straight line enrollment rate average from a historical study and just solve for the number of sites. (or any combination thereof)
Here’s the issue. A study might plan for 50 sites across 12 countries, and using this approach assumes every site is enrolling at a consistent rate. But the reality is far messier. Country-level regulatory approvals vary wildly—some take weeks or even months. Site activation distribution timelines are varied or getting longer, not shorter, with budget negotiations and contract finalization remaining the top barriers. And once sites are open, roughly half will meet or exceed their enrollment targets while the other half will under-enroll or enroll no one at all. Throw in the impact of screen failures that have been underestimated, or not estimated at all, and very quickly we end up with unrealistic and unreliable forecasts.

Only 59% of activated sites meet or exceed enrollment targets. 11% enroll zero patients.
When your forecast doesn’t account for this variability, you’re not planning—you’re hoping.
This problem is only getting harder, not easier. Protocol complexity has exploded over the past two decades. Endpoints per protocol and procedures per protocol have increased dramatically. Trials now span significantly more countries than they did 20 years ago. Each layer of complexity makes accurate forecasting more difficult—and more critical.

Protocol complexity has grown dramatically across every dimension since 2001.
What Data-Driven Sponsors Do Differently
The sponsors who consistently hit enrollment timelines share a few common traits. They don’t necessarily have better sites or simpler protocols. What they do have is a fundamentally different approach to forecasting and operational decision-making.
-
They model variability, not averages. Instead of plugging in a single enrollment rate per site, leading sponsors run simulation-based models that account for the full range of possible outcomes. A Bayesian approach, for example, samples from distributions of site-level performance across hundreds of simulations, producing a probability cone rather than a single line on a chart. This gives clinical operations teams a realistic picture of best-case, likely-case, and worst-case scenarios, all before the first patient is enrolled.
-
They use comparable study data, not just internal history. Internal data is valuable, but limited. Sponsors who forecast well supplement their own historical data with benchmarks from comparable trials matched by indication, population, phase, and geography. With datasets covering 60+ countries and hundreds of thousands of trials, it’s now possible to generate country-specific enrollment rates that reflect what actually happens in similar studies. And then they discount or multiply where appropriate, because the context may change or an eligibility criteria may affect screen failures.
-
They reforecast continuously. A plan created during feasibility becomes more outdated each day you get closer to FPI. As country selection firms up, you reforecast again. As site selection happens, you forecast again. The best-performing sponsors track planned vs. actual enrollment continually in real time and reforecast daily or weekly as new data comes in. When the gap between plan and actual starts widening, these teams can intervene not on a laundry list of excuses, but early based on KPIs: activating backup sites, loosing I/E criteria, reallocating resources to underperforming countries, or adjusting recruitment strategies before the delay becomes unrecoverable.
-
They connect planning to activation and enrollment. In too many organizations, the enrollment forecast lives in one system, site activation status lives in another, and recruitment campaign performance lives in a third. The sponsors who enroll on time have closed these gaps: their planning data feeds directly into activation tracking and enrollment monitoring, creating a single operational picture.
💡 See how ProofPilot's Enrollment Forecaster puts this approach into practice
 The fundamental shift from static, spreadsheet-based forecasting to simulation-driven planning.
The Cost of Getting It Wrong
The financial cost of enrollment delays is well-documented. But there’s a less-discussed cost: organizational credibility. When a clinical operations team repeatedly misses enrollment timelines, it erodes trust with executive leadership, with the sites who committed resources based on the sponsor’s projections, and with the patients who need these therapies.

A 6-month enrollment delay can cost anywhere from $108M to $1.44B in lost market opportunity.
Conversely, sponsors who can confidently predict their enrollment timelines earn a reputation as organized, data-driven partners exactly the kind of sponsors high-performing sites want to work with.
Moving From Reactive to Predictive
The technology to solve this problem exists today. AI-powered benchmarking can match your protocol against comparable studies and generate realistic country-level enrollment rates. Simulation modeling can quantify the range of possible outcomes rather than producing a single unreliable number. A sophisticated forecasting engine is built to ingest the inputs that matter to deliver forecasts that have the high chance of succeeding. And integrated planning platforms can connect your forecast to your actual site activation and enrollment data so that the plan stays current as reality unfolds.
The question is no longer whether better forecasting is possible. It’s whether your organization is willing to move beyond the spreadsheet.
Stop Forecasting With Spreadsheets
ProofPilot's Enrollment Forecaster uses Bayesian simulation across 400,000+ trials to replace guesswork with confidence—in minutes, not weeks. See how it works or talk with us today.


%201.svg)

