
 Planning
 Activation
 Engagement
 AI & Insights
 General

 Insights
.png?width=20&height=21&name=Frame%20(1).png) About
About


Enrollment is the single most common operational factor to blame for clinical trial delays, and is a perennial source of heartburn for all study teams. What’s frustrating is that in hindsight, most enrollment target misses aren't a surprise.
If you’re here, you may have learned this lesson the hard way.
This raises the obvious question: Why do individual study forecasts keep missing? The short answer: planning based on a basic patients per site per month (p/s/m) formula is always naively optimistic.
Let’s dig into why forecasts fail, and what it takes to build a forecast that helps you meet your enrollment targets.
Enrollment forecasting has many moving parts
A defensible enrollment plan must account for an unusually large number of interacting variables beyond a benchmark enrollment rate, such as:
-
Month and year
-
Current standard of care
-
Eligibility criteria
-
Number and geographic distribution of sites
-
Country-level regulatory timelines
-
Screen fail rates
-
Site activation windows
-
Discontinuation and dropout rates
-
Cohort structures
-
Seasonal enrollment patterns
-
And more
Each of these carries its own uncertainty, and they don't behave independently; a slow activation window in one country can lead to missed enrollment targets months later.
Many forecasting approaches used by sponsors today area based on a simple algebra 1 equation centered around p/s/m. Most study teams still create plans using old study averages without considering, least of all modifying, assumptions from the bulleted list above. To boot, doing all of this in excel spreadsheets becomes a nightmare of manual upkeep and tacit knowledge of the spreadsheet acquired over years of familiarity.
It's a slow, resource-intensive process, and teams must redo the work for every new study: pulling data from public registries, benchmark reports, and past trials for every new protocol.
Why forecasts miss
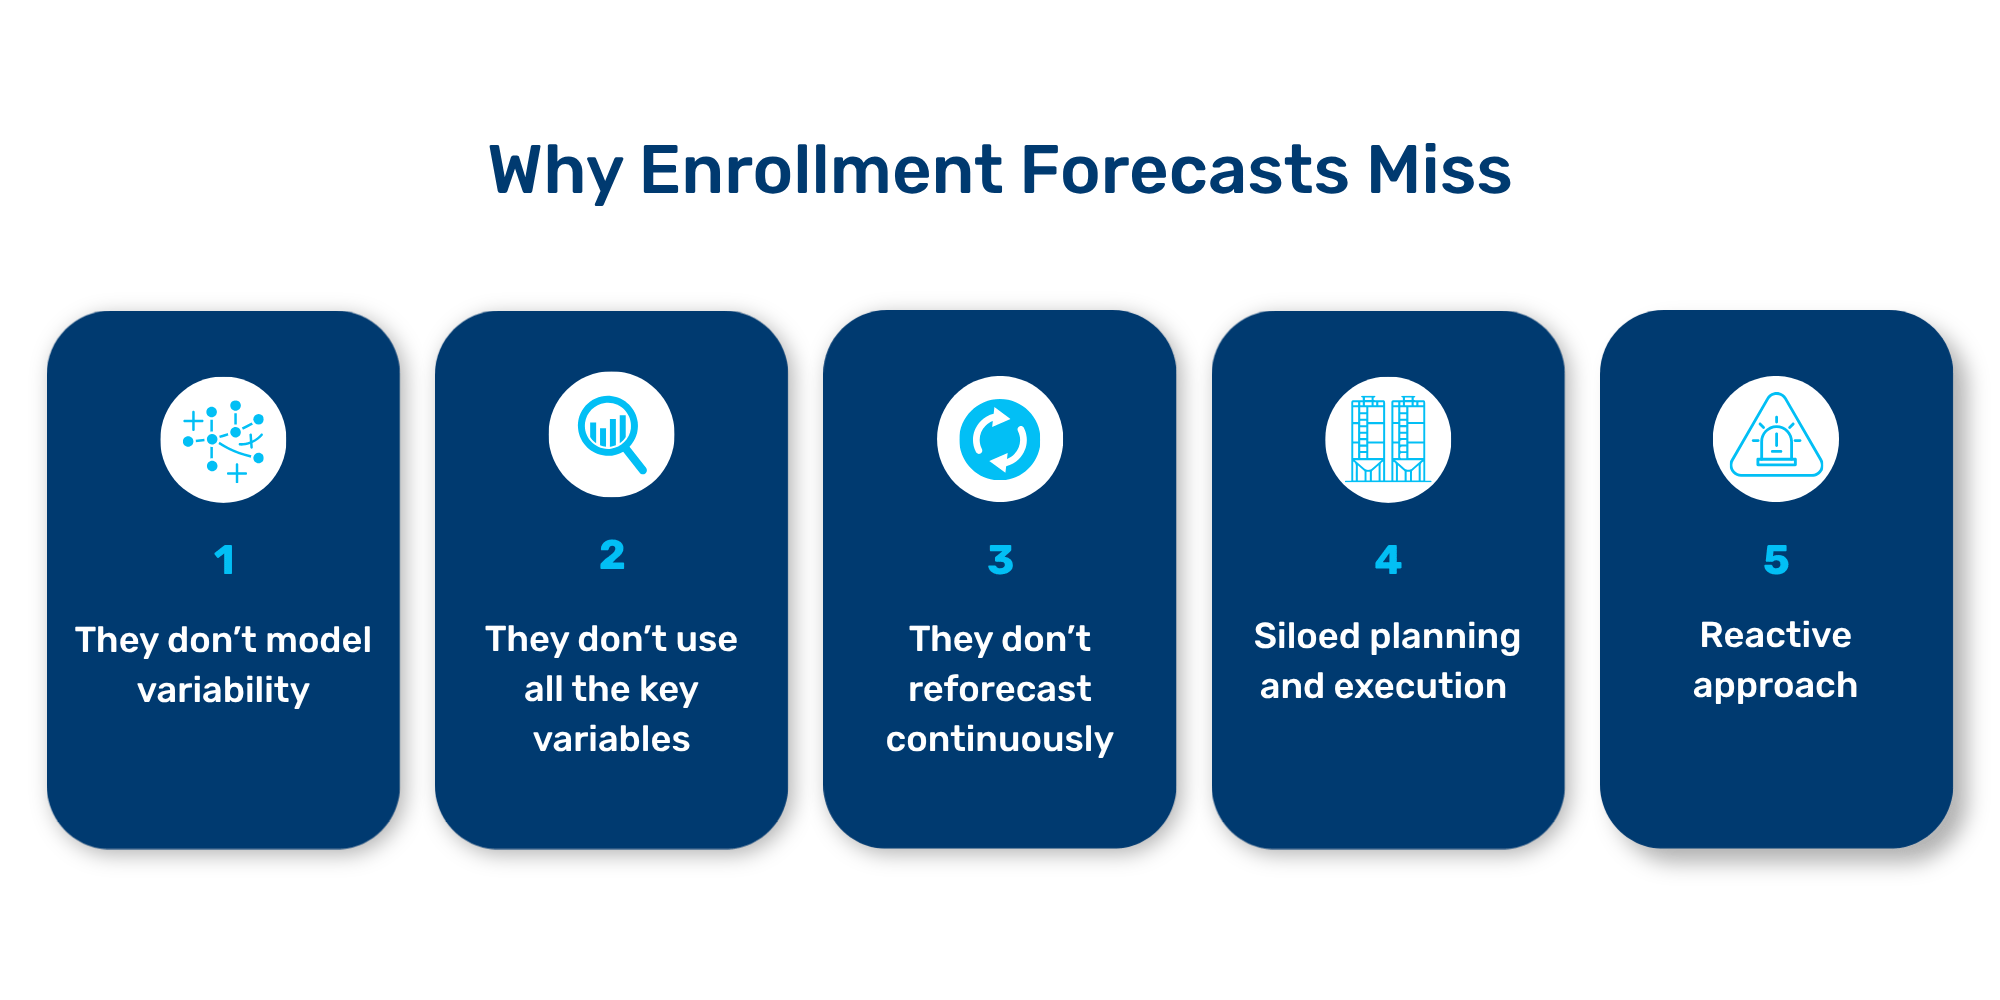
When enrollment forecasts break down, the same issues show up:
-
They don't model variability. A single-point estimate (e.g. "we expect 40 patients per month") treats an uncertain process as if it were fixed. Real enrollment doesn't move in a straight line; a forecast can’t reliably predict risk if it can’t quantify the range of realistic outcomes.
-
They don't use all the variables. Assumptions built on gut feel or a p/s/m rate from comparator trials aren’t enough. Teams need a broad, current base of comparable studies to benchmark against and a way to model all the key variables that drive enrollment to know whether an assumption is realistic or optimistic.
-
They don’t reforecast continuously. A plan built during feasibility is treated as final, even as country selection, site selection, and protocol details evolve. Each eligibility criteria shift, country swap, or a protocol amendment causes the forecast to grow more outdated, but no one is continuously updating and reforecasting with the most current data.
-
Planning and execution stay siloed. Feasibility, activation, and enrollment often live in different systems, owned by different teams, with no consistent thread connecting the original assumptions to the reality taking place.
-
The whole approach is reactive. Too many teams find out a trial is behind target after it’s already behind. By then, the ability to correct course is more expensive and less effective. The cost of finding out too late? An estimated $55,715 per day for Phase III trials, according to Tufts CSDD. Modeling and tracking with leading indicators upstream from counts of Randomized patients is the only way to be proactive.
The fix: forecasting built for uncertainty
None of this is to say enrollment risk is unmanageable. It means the forecast should act like real enrollment: a range of outcomes shaped by dozens of interacting, uncertain variables that are informed by real comparable data, adjusted and finalized by human judgment and open to revision as the study evolves.
That's the idea behind ProofPilot's Enrollment Forecaster.
-
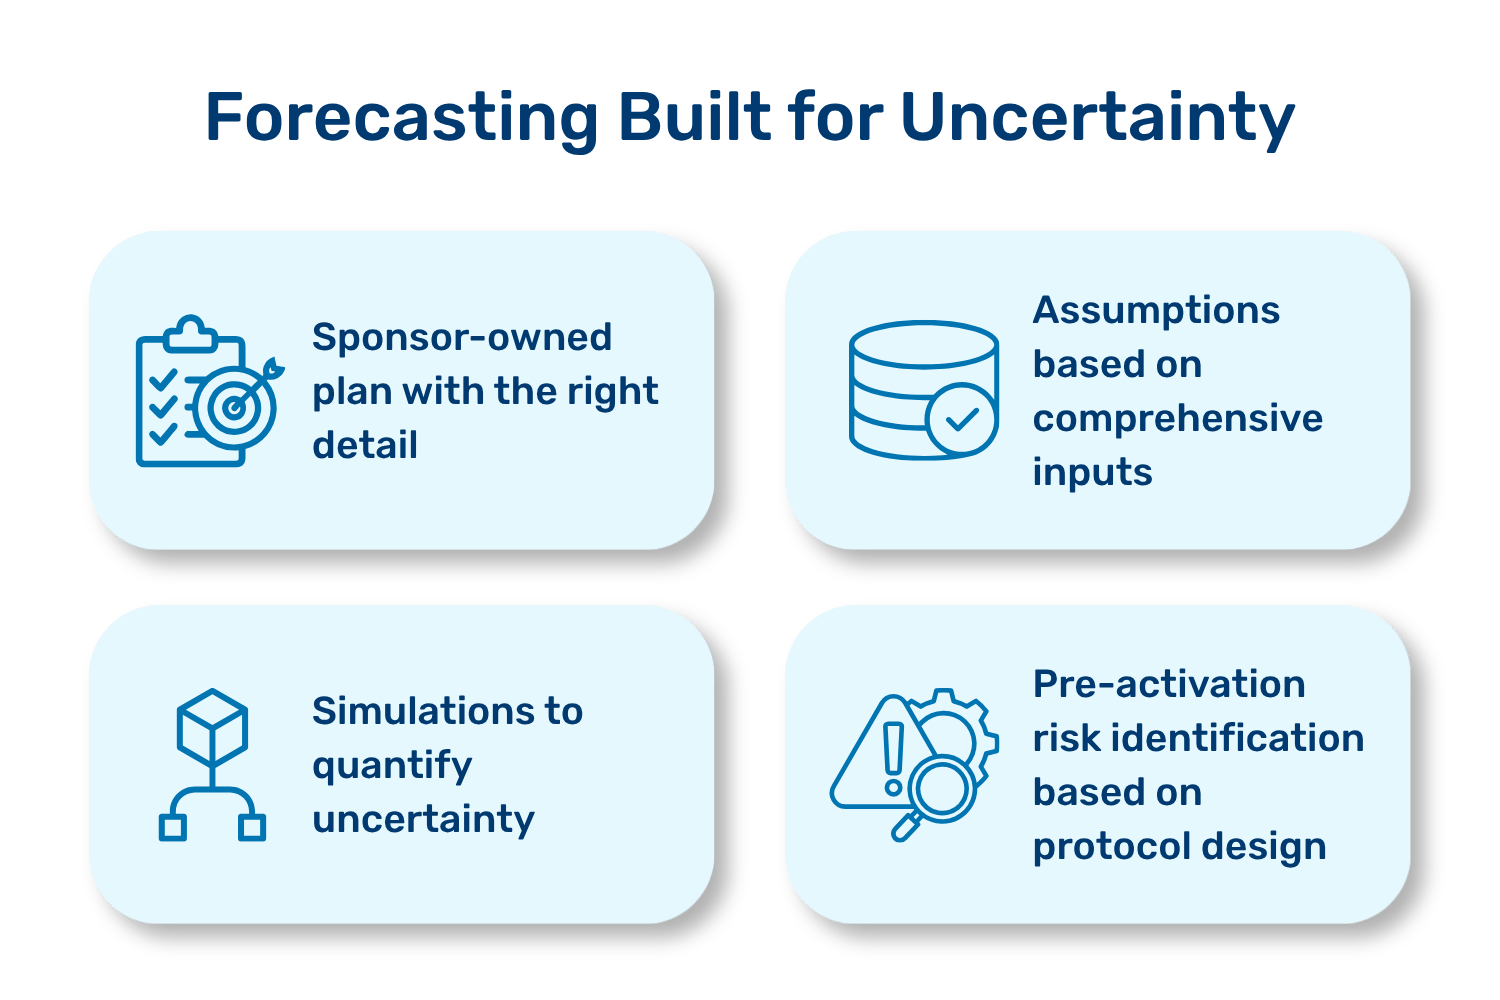
A sponsor-owned plan, built at the right level of detail. Instead of one top-line number, Enrollment Forecaster lets teams model by country, regio, cohorts, and site. Every assumption stays visible and easy to change. Regulatory approval timelines, activation windows, screening rates, dropout rates, seasonal slowdown, and enrollment velocity stay in the team's control.
-
Assumptions based on comprehensive inputs. Rather than starting from a blank spreadsheet and historical p/s/m averages, an AI-powered Forecast Assistant checks a study plan against 500,000+ comparable trials, or the team’s own internal study data. This gives teams a validated start and cuts the manual registry searches and reconciliation that normally eat up prep time. Throw in the ability to input a wide variety of upstream, independent variables as discussed, and you have yourself a well informed forecast based in reality.
-
Risk measured, not guessed. Enrollment Forecaster runs 10,000+ Monte Carlo simulations across key planning factors. It then shows best, base, and worst cases with set confidence intervals. That turns "we think enrollment will take about a year" into a full set of outcomes a team can not only stress-test before committing to a timeline, but can also defend when a board or steering committee asks how confident that timeline really is.
-
Protocol design informed early. A proprietary AI model scores a protocol across four key enrollment drivers—eligibility, visit burden, site activation, and operational performance—and identifies clear fixes. Teams can address risk at the design stage instead of once a study is already underway.
This is a different way to build a forecast. It treats uncertainty as something to be measured and pressure-tested, rather than something to be smoothed over with a single confident-sounding number.
⭐ ProofPilot’s Enrollment Forecaster cut projected LPI by 118 days and raised the chance of success to 94% for a top 10 sponsor. Read the case study here.
What this changes
The ultimate goal is simple: give sponsors a plan built on real data, tested against thousands of plausible scenarios, and clear about the risk before a single site activates. That’s the gap between meeting the enrollment target in a clinical trial in time to fix it, and finding out too late.
If your team still builds enrollment plans from spreadsheets and best guesses, ask this one question: how much of what's in that forecast has actually been tested?
Learn more about Enrollment Forecaster




%201.svg)

